Test Cases and Scenarios - Decision tables
Preparing a Decision Table
WHY:
This activity is designed to help you understand the methodology for building a Decision Table. Decision tables are used to lay out in tabular form all possible situations which a business decision may encounter and to specify which action to take in each of these situations. You will use them in your projects to clarify complex decision making situations and should find them useful in your work as a computer professional.
INFORMATION:
- Decision Table
- A decision table is a tabular form that presents a set of conditions and their corresponding actions.
- Condition Stubs
- Condition stubs describe the conditions or factors that will affect the decision or policy. They are listed in the upper section of the decision table.
- Action Stubs
- Action stubs describe, in the form of statements, the possible policy actions or decisions. They are listed in the lower section of the decision table.
- Rules
- Rules describe which actions are to be taken under a specific combination of conditions. They are specified by first inserting different combinations of condition attribute values and then putting X's in the appropriate columns of the action section of the table.
Decision Table Methodology
| 1. Identify Conditions & Values |
Find the data attribute each condition tests and all of the attribute's values. |
| 2. Compute Max Number of Rules |
Multiply the number of values for each condition data attribute by each other. |
| 3. Identify Possible Actions |
Determine each independent action to be taken for the decision or policy. |
| 4. Enter All Possible Rules |
Fill in the values of the condition data attributes in each numbered rule column. |
| 5. Define Actions for each Rule |
For each rule, mark the appropriate actions with an X in the decision table. |
| 6. Verify the Policy |
Review completed decision table with end-users. |
| 7. Simplify the Table |
Eliminate and/or consolidate rules to reduce the number of columns. |
A Simple Example
Scenario: A marketing company wishes to construct a decision table to decide how to treat clients according to three characteristics: Gender, City Dweller, and age group: A (under 30), B (between 30 and 60), C (over 60). The company has four products (W, X, Y and Z) to test market. Product W will appeal to female city dwellers. Product X will appeal to young females. Product Y will appeal to Male middle aged shoppers who do not live in cities. Product Z will appeal to all but older females.
- 1. Identify Conditions & Values
- The three data attributes tested by the conditions in this problem are gender, with values M and F; city dweller, with value Y and N; and age group, with values A, B, and C as stated in the problem.
- 2. Compute Maximum Number of Rules
- The maximum number of rules is 2 x 2 x 3 = 12
- 3. Identify Possible Actions
- The four actions are: market product W, market product X, market product Y, market product Z.
- 4. Enter All Possible Rules
- The top of the table would look as follows: Note that all combinations of values are present.
                    Rules
    Proc.  1   2    3    4    5    6    7    8   9   10   11   12
    Name
    Sex    F   M    F    M    F    M    F    M   F   M     F    M
    City   Y   Y    N    N    Y    Y    N    N   Y   Y     N    N
    Age   A    A    A    A    B    B    B    B   C   C     C    C
- 5. Define Actions for each Rule
- The bottom of the table would look as follows:
Market   1   2   3   4   5   6   7   8   9   10  11   12
   W     X               X               X
   X     X       X
   Y                                 X
   Z     X   X   X   X   X   X   X   X        X        X
- 6. Verify the Policy
- Let us assume that the client agreed with our decision table.
- 7. Simplify the Table
- There appear to be no impossible rules. Note that rules 2, 4, 6, 7, 10, 12 have the same action pattern. Rules 2, 6 and 10 have two of the three condition values (gender and city dweller) identical and all three of the values of the non- identical value (age) are covered, so they can be condensed into a single column 2. The rules 4 and 12 have identical action pattern, but they cannot be combined because the indifferent attribute "Age" does not have all its values covered in these two columns. Age group B is missing. The revised table is as follows:
                              Rules
    Process        1   2   3   4   5   6   7   8   9   10
    Gender         F   M   F   M   F   F   M   F   F   M
    City Dweller   Y   Y   N   N   Y   N   N   Y   N   N
    Age Group      A   -   A   A   B   B   B   C   C   C

                            Actions
    Market         1   2   3   4   5   6   7   8   9  10
      W                X           X           X
      X            X       X
      Y                                    X
      Z            X   X   X   X   X   X   X           X
DISCUSSION:
Step 1. Identify Conditions & Values
We first examine the problem and identify the data attributes upon which the decision or policy depends. We then list the possible values of each data attribute. Often, answering the question: "What do I need to know in order to take action in this situation?" will help identify the appropriate condition attributes.
Step 2. Compute Maximum Number of Rules
A rule is determined by a different combination of the condition attributes values. Since we have listed these values in the previous step, the multiplication rule of counting tells us that there will be no more columns than the product of the number of values for each of the condition attributes. This can be easily verified by constructing a tree diagram listing all possible values of each attribute for each branch of the preceding attribute. The number of leaves of the tree will be the product described above. Since some combinations of attribute values may be impossible, the actual number of rules may be less that the maximum.
Step 3. Identify Possible Actions
The actions describe the decisions to be made or the policy rules to be followed. Asking the question, "What are the different options for implementing the decision or policy?", should help identify the possible actions.
Step 4. Enter All Possible Rules
We now begin to build the decision table by listing the condition descriptions in the left margin of the upper part of the table and the action descriptions in the left margin of the lower part. Then we write consecutive numbers from 1 to the maximum number of rules across the top. In the rule columns and the condition rows, we list all possible combinations of condition attribute values. A rule of thumb for arranging the rule combinations is to alternate the possible values for the first condition, then repeat each value of the second condition as many times as there are values in the first condition, repeat each value of the third condition as many times as needed to cover one iteration of the second condition values, etc. See Model 1.
Step 5. Define Actions for each Rule
In this step we decide which actions are appropriate for each combination of condition attribute values and mark an X in that column of the action row. This should be fairly straightforward if the decision making procedure is well defined. If it is not well defined then the organization of the decision table makes it easier to get the end-user to specify the action(s) for each rule. See next step.
Step 6. Verify the Policy
Review the completed decision table with the end-users. Resolve any rules for which the actions are not specific. Verify that rules you think are impossible or cannot in actuality occur. Resolve apparent contradictions, such as one rule with two contradictory actions. Finally, verify that each rule's actions are correct.
Step 7. Simplify the Decision Table
In this step we look for and eliminate impossible rules, and also combine rules with indifferent conditions. An indifferent condition is one whose values do not affect the decision and always result in the same action. Impossible rules are those in which the given combination of condition attribute values cannot occur according to the specifications of the problem. (E.G. if we assumed for marketing purposes that all middle-aged men lived in the city). To determine indifferent conditions, first look for rules with exactly the same actions. From these, find those whose condition values are the same except for one and only one condition (called the indifferent condition). This latter set of rules has the potential for being collapsed into a single rule with the indifferent condition value replaced with a dash. Note that all possible values of the indifferent condition must be present among the rules to be combined before they can be collapsed.
MODEL:
See handout in class
LEARNING OBJECTIVES:
- Discover how to prepare a decision table.
- Discover how to simplify a decision table.
- Understand the application of decision tables to system analysis and design.
PERFORMANCE CRITERIA:
- Quality of the answers to the Critical Thinking Questions.
- Completeness
- Clarity
- Depth
- Level of understanding of the process for constructing decision tables.
RESOURCES:
- Chapter 6 in Systems Analysis and Design Methods (especially pp. 222-224)
- 30 minutes
PLAN:
- Choose roles if you have not already done so.
- Read over the methodology and work through the simple example and the model handout.
- Answer the Critical Thinking questions.
CRITICAL THINKING QUESTIONS:
- How do you determine the number of columns (rules) a decision table should have? I.e., if there are three conditions and the first condition has 3 values, the second 4 and the third 2, how many rules will there be?
- Assume that the first condition attribute values are A, B, C; the second condition attribute values are W, X, Y, Z; and the third condition attribute values are Y, N. List the first 12 rules for this problem.
- Suppose that we did assume that all middle-aged men lived in the city in the Model. How would this change the final decision table?
- Determine which rules were combined to get the decision table in Figure 11.16 from the decision table in Figure 11.14 in Model 2. Verify that the simplification process was valid.
- Which was the most difficult step in the methodology to understand? Can you reword it and its discussion to make it clearer?
SKILL EXERCISES:
- Work through the following problem to construct an initial decision table.
- Simplify your table by removing impossible rules and collapsing rules with indifferent conditions.
- A student may receive a final course grade of A, B, C, D, or F. In deriving the student's final course grade, the instructor first determines an initial or tentative grade for the student, which is determined in the following manner:
- A student who has received a total of no lower than 90 percent on the first three assignments and exams and received a score no lower than 70 percent on the fourth assignment will receive an initial grade of A for the course. A student who has scored a total lower than 90 percent but no lower than 80 percent on the first three assignments and exams and received a score no lower 70 percent on the fourth assignment will receive an initial grade of B for the course. A student who has received a total lower than 80 percent but no lower than 70 percent on the first three assignments and exams and received a score no lower than 70 percent on the fourth assignment will receive an initial grade of C for the course. A student who has scored a total lower than 70 percent but no lower than 60 percent on the first three assignments and exams and received a score no lower 70 percent on the fourth assignment will receive an initial grade of D for the course. A student who has scored a total lower than 60 percent on the first three assignments and exams, or received a score lower than 70 percent on the fourth assignment, will receive an initial grade of F for the course. Once the instructor has determined the initial course grade for the student, the final course grade will be determined. The student's final course grade will be the same as his or her initial course grade if no more than three class periods during the semester were missed. Otherwise, the student's final course grade will be one letter grade lower than his or her initial course grade (for example, an A will become a B).
- Are there any conditions for which there was no action specified for the instructor to take? If so, what would you do to correct the problem?
Decision tables
- Decision tables are an excellent tool
- - To capture certain kinds of system requirements.
- - To document internal system design
- They are used to record complex business rules that a system must implement.
- In addition, they can serve as a guide to creating test cases
- Decision tables are a vital tool in the tester's personal toolbox
- Unfortunately, many analysts, designers, programmers, and testers are not
familiar with this technique
Technique:
- Decision tables represent complex business rules based on a set of conditions.
The general form is
- Table 5-1: The general form of a decision table.
Table 5-1: The general form of a decision table.
Create a Decision Table
- We give Married and good students 60 CAD discount.
- For Married students without good mark, we give them 25 CAD discount.
- For good students without Married, we give them 50 CAD discount.
Table 5-3: Adding a single action to a decision table.
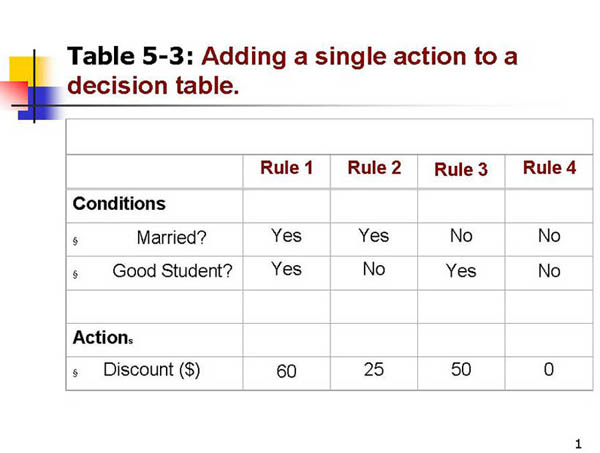
Table 5-4: A decision table with multiple actions
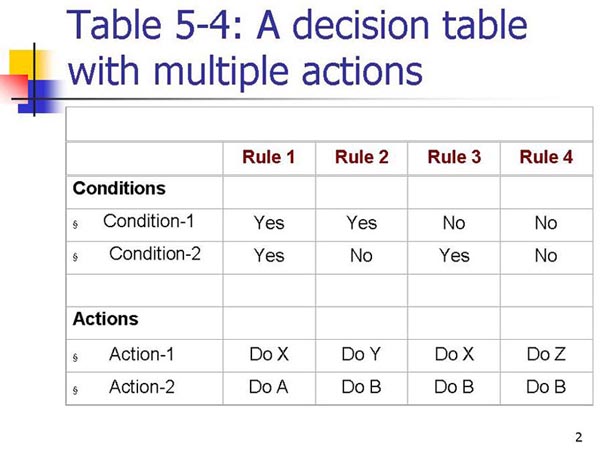
Table 5-7: A decision table converted to a test case table.
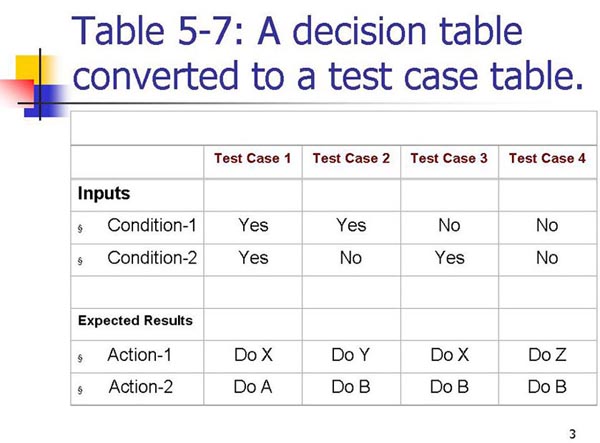
Table 5-5: A decision table with non-binary conditions
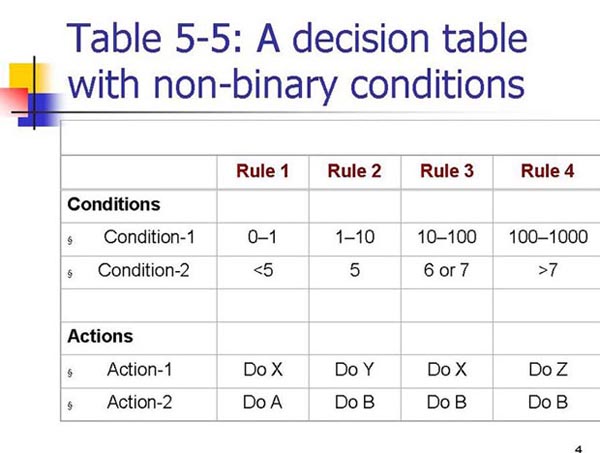
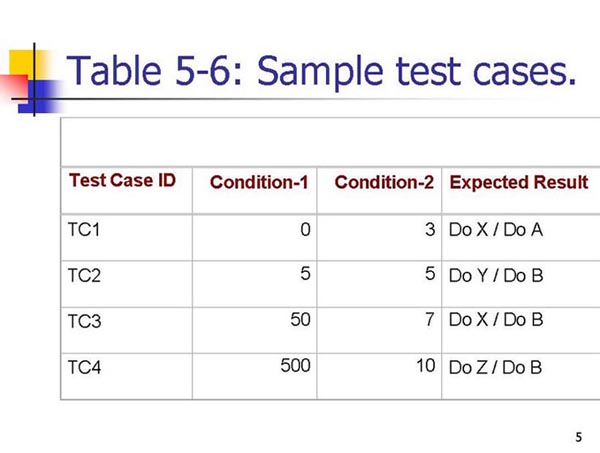
Table 5-6: Sample test cases.
Example
Referring to the Trade Web page of the Brown & Donaldson Web site described in
following, consider the rules associated with a Buy order
Only when a valid symbol, valid quantity, and sufficient funds are available
should the Buy order be placed
A decision table for the Brown & Donaldson Buy order.
Table 5-8: A decision table for the Brown & Donaldson Buy order.
Don't Care." Rule
If the Symbol is not valid, ignore the other conditions and do not execute the
Buy order.
Don't Care." Rule
Combined Rules
Symbol and Quantity can be combined because whether Sufficient Funds are
available does not affect the action
Combined Rules
Example: University Registration
The following screen is from the Stateless University Registration System.
It is used to enter new students into the system, to modify student
information, and to delete students from the system.
University Registration
First Name:
Last Name:
Street:
City: State:
Phone: Zip:
Student ID:
Delete Modify
University Registration
To enter a new student, enter name, address, and telephone information on the
upper part of the screen and press Enter.
The student is entered into the database and the system returns a new
StudentID.
To modify or delete a student, enter the StudentID, select the Delete or
Modify radio button and press Enter.
Decision tables
Decision tables are used to document complex business rules that a system must
implement. In addition, they serve as a guide to creating test cases.
Conditions represent various input conditions.
Actions are the processes that should be executed depending on the various
combinations of input conditions.
Each rule defines a unique combination of conditions that result in the
execution ("firing") of the actions associated with that rule.
Create at least one test case for each rule.
If the rule's conditions are binary, a single test for each combination is probably sufficient.
On the other hand, if a condition is a range of values, consider testing at both the low and
high end of the range
Reference
A Practitioner's Guide to Software Test Design
by Lee Copeland ISBN:158053791X
Artech House ?2004
Beizer, Boris (1990). Software Testing Techniques (Second Edition). Van
Nostrand Reinhold.
Binder, Robert V. (2000). Testing Object-Oriented Systems: Models, Patterns,
and Tools. Addison-Wesley.
|